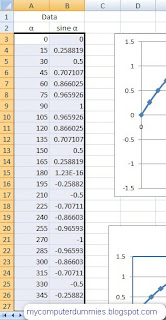
Make a sine graph in excel 2007 (plotting sine wave on Excel).By using Microsoft Excel, we can easily create a graph sine, cosine graphs, charts and graphs tangent of the other trigonometric functions. Specifically discussed in this post about how to create charts in Excel sinuses that might be useful for beginner friends.
To create a graph of sin in Excel 2007, following procedure below:
1. Create a table as below
In column A with the contents of the data point, in the following example created scale with intervals of 15 degrees.
In cell B3 enter the formula "= SIN (radians (A3))"
Copy the formula from B3 up to B27
2. Block range A3: B27
On the menu bar choose Insert - Scatter - Select the type which has a scatter graph line
3. The result will look like below
If you interest with this tutorial, Sample files can be downloaded here sine graph


thaks gan infonya, salam sukses
ReplyDeletethank you very much, although I think I'm not going to make a sine graph for a couple of years ahead, this tutorial helps me a lot
ReplyDelete